


Introduction
In a landscape where the art of filmmaking meets the science of market success, movie producers often find themselves at a crossroads. The goal is to create a cinematic experience that not only resonates with audiences emotionally by getting good ratings and reviews but also performs exceptionally at the box office. Achieving both critical acclaim and financial success in the highly competitive film industry is a remarkable accomplishment.
To aid producers in this challenge, we’ve created an interface that simplifies the complexity of movie-making variables. It empowers producers to fine-tune key elements that can elevate a film’s potential for success. By selecting a genre from the top-five favorites, producers can explore a variety of influential factors, including:
- Optimal Runtime: Finding the best film’s length to keep audiences engaged from opening credits to the final scene.
- Casting Dynamics: Assembling a cast that not only has the right chemistry but also brings a proven track record to the table.
- Narrative Appeal: Crafting story arcs and character developments that are known to captivate viewers within the chosen genre.

This tool is more than just a repository of data; it’s an analytical engine that processes industry benchmarks, and audience preferences. It provides producers with a strategic knowledge, integrating both quantitative data and qualitative insights to guide decisions from pre-production to premiere.
Our method combines deep industry expertise with a sophisticated predictive analytics model. This provides strategic advice based on a thorough knowledge of past successes. It’s a groundbreaking approach in movie-making, where well-informed choices are at the forefront. Producers are empowered with insights to craft films that captivate wide audiences and also showcase the compelling force of storytelling.
Let’s start the journey!
Before delving right into genre-specific analyses in the film industry, we need to address some fundamental questions to highlight the general trends of the data at our disposal and highlight the 5 main genres. Firstly, we’ll explore how genre influences a film’s ratings and revenue, which provides insights into the commercial and critical success of different genres. Next, we’ll examine the relationship between winning awards and a film’s box office performance. It is primordial to understand the commercial impact of critical acclaim. Additionally, we’ll investigate the correlation between a movie’s runtime and its likelihood of receiving awards, offering valuable guidance for film production. These initial analysis lay the groundwork for more detailed, genre-focused analysis.
How do rating and revenue vary as a function of the genre?
Distribution of movie ratings across genres
The distribution plots illustrate that movie ratings across genres tend to follow a slightly left-skewed Gaussian or normal distribution, with most ratings clustering around the mean. Each genre shows a distinct peak, with ‘Drama’ having the most substantial number of movies. The spread of the distributions indicates the variability of ratings within each genre. We can see that Drama, Comedy, Thriller/Action and Romance are the top genres in the world! We will detail for each of those 5 genres what are the main things to implement in a movie in order to make it successful.
Which relation between the screentime and the opportunity to win an award?
Distribution of movie runtime for all awarded movies
This plot shows histograms for movie runtime categorized by award status: Awarded Movies, Nominated Movies, and Non-awarded and Non-nominated Movies. Awarded and nominated movies tend to have a distribution centered around a higher runtime than movies that are not, suggesting that movies with higher runtimes might have a higher chance of winning awards. Non-awarded and Non-nominated movies show a broad distribution, indicating a wide range of runtimes, with the majority leaning towards shorter runtimes. This category’s histogram is significantly taller, suggesting it contains a much larger number of movies compared to the other two. A potential insight here could be that while both awarded and nominated movies tend to have a certain runtime, simply having a runtime within that range does not guarantee recognition.
Movie runtime for awarded movies and not awarded movies
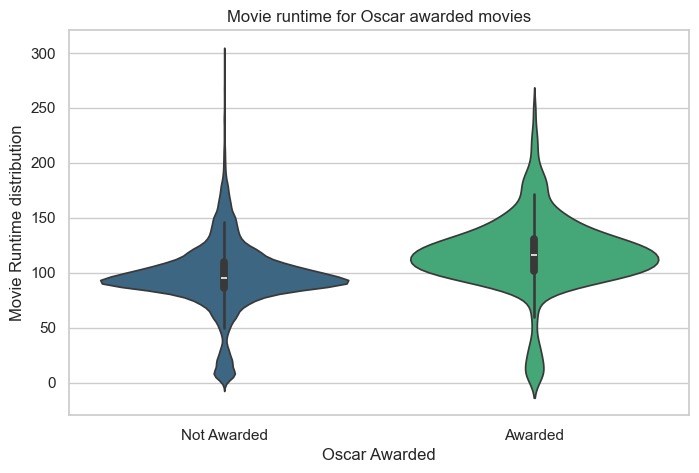
This violin and box plot combination displays the distribution of movie runtimes, differentiating between movies that were not awarded and those that were. The ‘Not Awarded’ category has a wide and flat distribution, suggesting a high variability in runtimes, whereas the ‘Awarded’ category shows a more peaked and narrow distribution, implying a concentration around a specific runtime. The box plot within the violin plot for awarded movies shows a median value that is higher than the not awarded, which might imply that movies with longer runtimes tend to win awards, but the spread is less, suggesting a tighter criterion for runtime among awarded films. The notable number of outliers in the ‘Not Awarded’ category could indicate that there is less consistency in the success of movies with very short or very long runtimes in this group.
What is the relation between being awarded and revenue?
Distribution of Movie box office revenue
This graph shows the frequency distribution of movie box office revenue on a logarithmic scale. The x-axis spans a wide range, from $10,000 to $1 billion, which indicates the inclusion of both small indie films and blockbuster hits. The distribution peaks at the lower end of the revenue scale and then tapers off, which is typical of entertainment media where a few hits make a large portion of the revenue, and many films make relatively little. This kind of distribution is often referred to as a “long-tail” distribution, where the tail of the distribution (lower revenue films) is very long compared to the head (high revenue films). The graph can help industry analysts understand the distribution of revenues across movies and can provide insights into the financial risks and rewards of the movie industry.
Distribution of Movie profit
Similar to the box office revenue graph, this shows the frequency distribution of movie profits, also on a logarithmic scale. This distribution appears to be more centrally peaked, suggesting that while there are outliers with extremely high profits, there’s a common profit range where most movies lie. The tail of the distribution extending towards higher profits is less steep compared to the box office revenue graph, indicating that while fewer movies make extremely high profits, the drop-off is not as sharp. This information could be valuable for movie producers and investors to gauge expected profits and understand the profitability landscape of the film industry.
Density function of movie profit
The plot displays density functions for the profit of movies, also categorized by their award status. The x-axis is on a logarithmic scale, indicating a wide range of profits. We can see distinct peaks for each category. Awarded movies have the highest peak, followed by nominated movies, which suggests that, on average, awarded movies tend to be more profitable. Non-awarded and Non-nominated movies have a flatter distribution with a peak at a lower profit level, indicating that these movies, while varied, generally earn less than their awarded or nominated counterparts. The log scale indicates that there are movies with very high profits, but they are less frequent, as seen by the density curves approaching the tail end.
Causal analysis
We are now going to check the relations between multiple effects on the movie profits. Since there could be some confounders in the analysis, we’re going to remove these biases with a model using propensity scores:
similarity(x, y) = 1 - | propensity_score(x) - propensity_score(y) |
This function captures the difference in scores like a distance, but since the distance defined like that would always be between 0 and 1, subtracting it from 1 would be a meaningful measure to use for similarity.
Next, we will perform a pairwise matching between films with the same propensity score.
This causal analysis will investigate the effect of being awarded or having a great rating on the movie’s profits.
Awards vs Profits
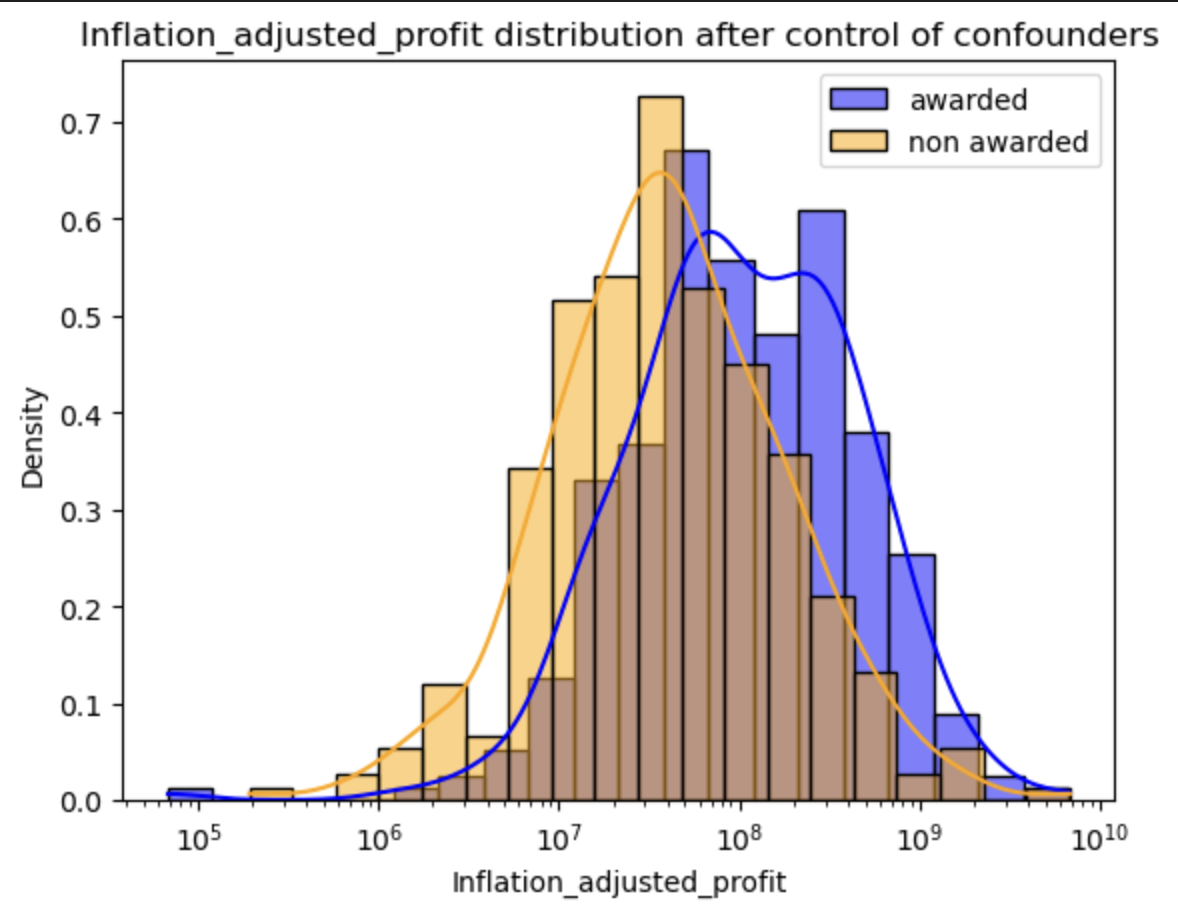
This graph (after controlling for confounders) seems to show a slightly weaker link than before between winning an award and making more profit. This shows that there is a correlation between confounders and profits generated by films. As we suspected:
- A film’s IMDb index is clearly positively correlated with profits generated and with whether or not it has won an award.
- Release date may also be related to inflation-adjusted earnings. Indeed, a film released in the 1950s had no chance of making the same profits as one released today; this can be explained by the fact that the film industry was much more restricted back then.
To confirm our analysis we perform a statistical test comparing the inflation-adjusted profits between awarded and non-awarded movies.
| t-value | p-value |
|---|---|
| 3.5209 | 0.00046 |
There yields a significant result due to the p-value very low. This suggests that there is a statistically significant difference in profits between movies that have received awards and those that have not.
The last step is to check whether we get the same result for all 5 film genres. To do so we perform a statistical test:
| Film genre | t-value | p-value |
|---|---|---|
| Drama | 4.1644 | 3.8874 e-5 |
| Family | 0.2926 | 0.7702 |
| Action & Adenture | 3.1385 | 0.0024 |
| Science-fiction | -0.3015 | 0.7657 |
| Horror | 1.1604 | 0.2793 |
This is interesting, because it would seem that this correlation between rewards received and profits only affects certain genders. Indeed, we can see that for films in the Drama and Action-Adventure genres, the result is significant (due to a very low p-value), whereas for films in the Family, Science-fiction and Horror genres, the result is inconclusive because the p-value is too high.
Ratings vs Profits
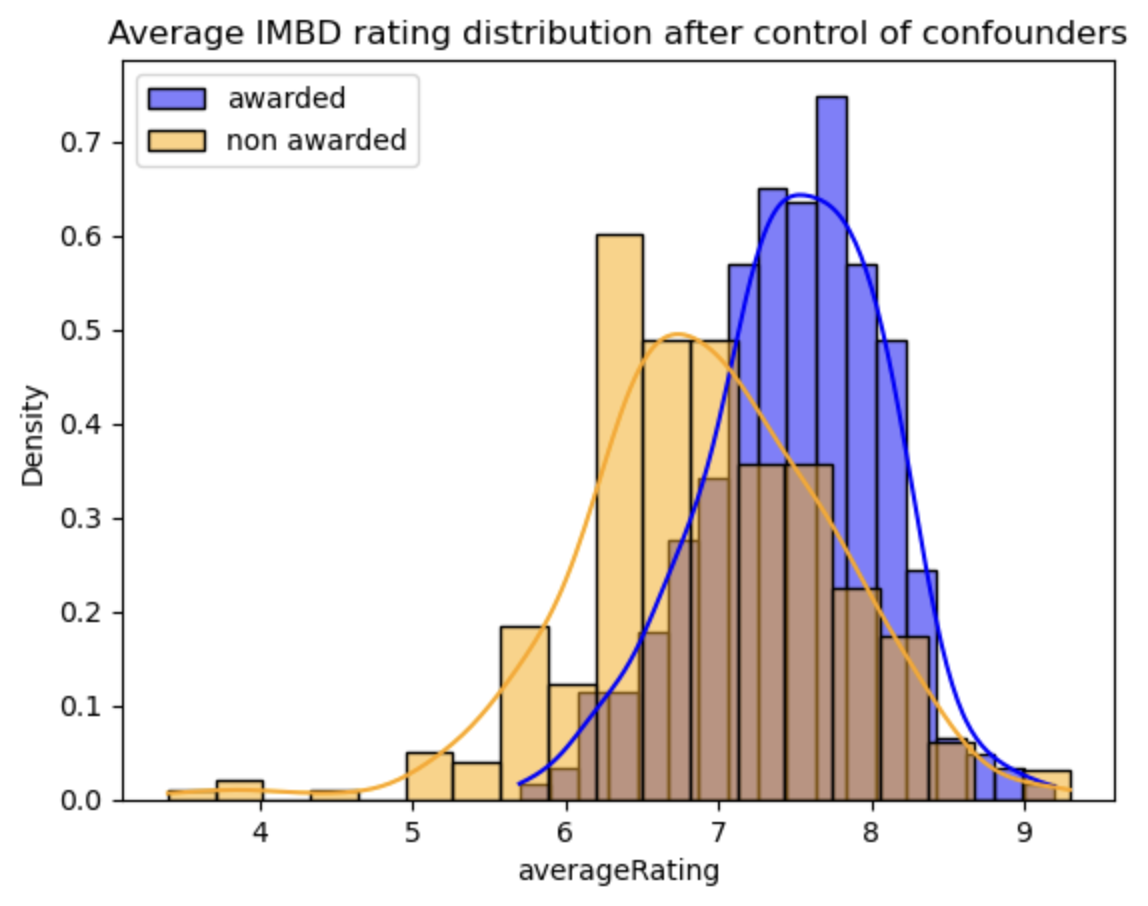
On this graph, we can see a clear distribution of average IMDb ratings for films, with a distinction between those that have been awarded and those that have not. The histogram demonstrates a positive skew towards higher ratings for awarded films, which suggests that films with higher IMDb ratings are more likely to have won awards. This aligns with the expectation that higher quality, as perceived by audiences and critics (reflected in IMDb ratings), increases the likelihood of winning awards.
| t-value | p-value |
|---|---|
| 10.1754 | 1.2792 e-15 |
The t-value of 10.1754 with a p-value of 1.2792e-15 indicates an extremely strong statistical significance. This low p-value essentially rejects the null hypothesis that there is no difference in average ratings between awarded and non-awarded films, confirming that the difference observed is highly unlikely to have occurred by chance.
| Film genre | t-value | p-value |
|---|---|---|
| Drama | 8.2264 | 3.4129 e-15 |
| Family | 5.3712 | 3.0938 e-7 |
| Action & Adenture | 3.2693 | 0.0016 |
| Science-fiction | 0.3961 | 0.6964 |
| Horror | 1.7496 | 0.0598 |
Drama films have a very strong correlation between awards and IMDb ratings, as indicated by a high t-value of 8.2264 and a practically negligible p-value of 3.4129e-15. This suggests that in the Drama genre, there is a significant relationship between the reception of awards and higher ratings.
Family films show a significant result, with a t-value of 5.3712 and a p-value of 3.0938e-7, implying that awarded Family films tend to have higher IMDb ratings.
Action & Adventure films also demonstrate a significant positive association between awards and ratings, with a t-value of 3.2693 and a p-value of 0.0016, although the strength of this relationship is weaker than in Drama and Family films.
Science-fiction films, however, do not show a significant correlation between awards and IMDb ratings, with a t-value of 0.3961 and a high p-value of 0.6964, indicating that other factors might be at play in determining the success or acclaim of films in this genre.
Horror films are on the edge of significance, with a t-value of 1.7496 and a p-value of 0.0598. This p-value is just above the conventional threshold for significance (0.05), suggesting a possible but not definitive link between awards and ratings for Horror films.
Scatterplot of movie runtime vs profit
This scatter plot shows the relationship between movie runtime and profit, with movies that have been awarded depicted in blue and those not awarded in red. The plot suggests there is a wide range of profits for movies of any runtime, but there does not appear to be a strong or clear correlation between the two variables. Awarded movies are scattered throughout the profit range but are more prevalent at higher profit levels. This could suggest that while longer movies are not guaranteed to be more profitable, those that win awards may have a better chance at higher profits. The concentration of red dots (not awarded movies) across all profit ranges indicates that most movies do not win awards, regardless of their profitability.
What is the relationship between ratings and profit?

This scatter plot displays movie profits against their average ratings, with movies differentiated by whether they were awarded or not. There is a dense clustering of movies in the lower profit range across all ratings, with fewer movies achieving high profits. This suggests that while many films are made and rated, only a few reach high profitability. Awarded movies (blue points) are present across a wide range of profits, but with a noticeable presence in the higher profit tiers, indicating that award-winning films may have a better chance at earning more. The vertical spread of points at each rating level indicates a large variability in profit for movies with similar ratings, suggesting that factors other than ratings significantly influence profitability.
How does the movie rating distribution vary across the continents?
This set of histograms shows the distribution of movie ratings across different continents. The distribution shapes vary by continent, with Asia having a broader range of average ratings, and other continents like Africa and Oceania having fewer movies with a tighter distribution around the middle ratings. The USA histogram shows a high count of movies with a wide range of ratings, reflecting a large and diverse film industry. Such distributions are useful for understanding how movie ratings differ across the world and can indicate regional preferences or differences in movie production quality.
How does the movie box office distribution vary across the continents?
This collection of plots illustrates the profit distribution of movies across different continents, displayed on a logarithmic scale. There is a noticeable decline in frequency as profit increases, which is consistent across continents, suggesting that high-profit movies are rare globally. In some continents like Africa, there is a steep drop-off in the number of high-profit movies, whereas in Oceania, Europe, and the USA, the drop-off is more gradual, indicating a presence of more movies that achieve high profits. This analysis helps in comparing the film industry’s financial success across different markets and can guide decisions regarding distribution and marketing strategies
How does the profitability of movies vary across genres
This box plot presents the distribution of box office revenue by genre, showing the median, interquartile range, and outliers. Drama and family genres have lower median revenues but a wide range of outcomes, as indicated by the long whiskers and outliers. This variability could reflect a mix of low-budget dramas and high-grossing family blockbusters. Action/Adventure and Fiction have higher medians and less variability compared to Drama and Family, suggesting these genres are more consistently high-earning. Other genres show a lower median but also have a considerable spread, which could include niche films with both low and unexpectedly high revenues. Understanding the revenue distribution by genre can inform producers and investors about the potential financial risk and return associated with different types of movies.
Now that the context is set, pick one of the top 5 genre at the beginning of this page and discover how to make the best movie!